Measuring Call Centre Agents on the number of calls – what you really need to know
If you are still measuring call centre agents on the number of calls they are handling, this article will explain why it’s an unfair metric to focus on.
But before we get into it, I’m not here to judge.
Measuring agents on the number of calls they take each day is often one of the easiest bits of data to obtain from any system.
And whilst there are better ways to measure agent performance, most people have not had any formal training in contact centres and have never been made aware that there are viable alternatives.
So let’s start with this scenario.
It’s Monday morning and the calls are pouring in.
But you planned well and you’ve got the right agent capacity in place.
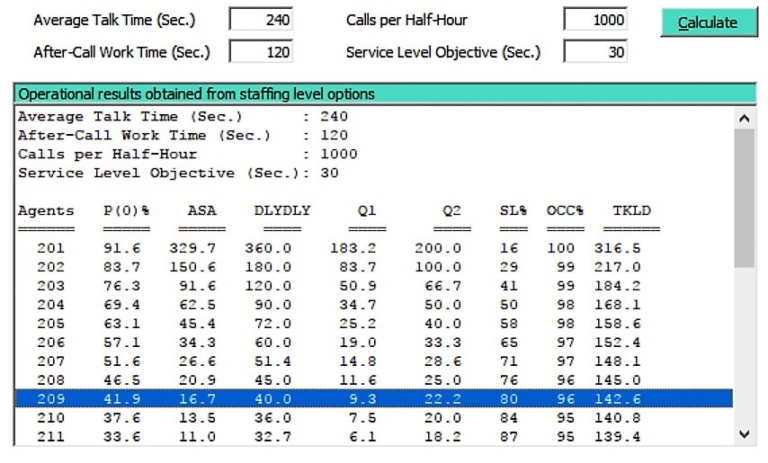
For the morning interval of 9:00 AM to 9:30 AM, here’s what your stats look like using a simple Erlang C calculator:
 Your Service Level objective is 80/30.
Based on a Talk Time of 4 minutes, an ACW of 2 minutes and a volume of 1,000 calls, you require 209 Agents to login and be part of capacity so that you can achieve your 80/30.
All good.
Now let’s look at the Occupancy stats for this interval
In this same scenario, you can see that the Occupancy Rate – which is an outcome or result – stands at 96%.
Simply put – that means during this 30-minute interval, your Agents are talking or doing their After Call Work (ACW) for 29 minutes.
That means that they will experience only 1 minute of Available Time over the course of that half-hour period (not much).
What about calls handled per Agent?
Well – if we are receiving 1,000 calls distributed across 209 Agents that works out to an average of 4.8 calls per Agent for that interval (using simple math).
Same Contact Centre – later that same day…
In this Centre, the workload drops significantly in the afternoon.
For the afternoon interval of 4:00 PM to 4:30 PM, here’s what your stats look like using a simple Erlang C calculator:
 Your Service Level objective remains (obviously) at 80/30.
Based on a Talk Time of 4 minutes, an After Call Work time of 2 minutes (kept at the same levels as the morning interval for purposes of simplicity) and a volume of 150 calls, you require 35 Agents to login and be part of capacity so that you can achieve your 80/30.
All good.
But Occupancy has changed
But you can see that the Occupancy Rate – which is an outcome or result – has fallen from its morning level of 96% down to 86% – even though we are still meeting our Service Level of 80/30.
What about calls handled per Agent?
Well – with 150 calls across distributed across 35 Agents that works out to an average of 4.3 calls per Agent for that interval (using simple math).
This compares to the 4.8 average calls per Agent in the morning interval.
So are the afternoon Agents less ‘productive’ than our morning Agents?
Simply put – no.
The Agents who are logged into capacity in the afternoon interval of 4:00 PM to 4:30 PM are operating in a smaller group.
Put another way, they are working with only 34 other colleagues in their ‘pool’.
In the morning interval, there were 209 Agents in the pool – clearly a much bigger pool.
What the Pooling Principle teaches us

At the same Service Level achievement, smaller pools have lower Occupancy rates as compared to larger pools.
When I teach this principle for certification exam purposes I like to say:
Big pool – big Occupancy…
Small (or smaller) pool – smaller Occupancy…
This outcome stems from the mathematical realities of how inbound Centres & queues work.
So what does this mean for Contact Centre & Service Centre management?
In all cases, measuring call centre agents on the number of calls handled is incorrect – from a mathematical standpoint, an operations standpoint and a people management standpoint.
There are operational realities at work over which agents don’t have control.
One of those realities is the Pooling Principle.
Would it be fair to say that the Agents working from 9:00 AM to 9:30 AM are more productive than the Agents working from 4:00 PM to 4:30 PM?
No – it wouldn’t.
And yet around the world, in too many centres, call centre agents are measured on the number of calls handled. Judged and evaluated simply by how many calls they take.
Sometimes people tell me – yes Dan I get it, but I still target agents on the quantity produced.
But you can’t say you ‘get it’ and then do that – it’s contradictory.
How high can occupancy be?
If you are operating with large pools of agents across many intervals – keep your eye on the Occupancy rates they are experiencing.
The purpose is not to judge them – but to help them.
It’s proven that when Agent Occupancy hits 88% and above for long periods of time (day after day, week after week, month after month), burn-out sets in.
Understanding the Pooling Principle also helps with queue design – for example, whether to split a large queue into smaller queues – or combine smaller queues into a larger queue.
As a side note, I’ve avoided creating an ‘extreme’ example intentionally (i.e. a .5 call Per Agent variance between morning and afternoon.)
But for some centres – especially those with multiple queues – Occupancy figures can swing much more dramatically.
What about call handling normalisation?
For the advanced reader – yes there are normalisation techniques that help you understand the ‘rate’ of call handling across groups with different Occupancy rates.
We’ll save that discussion for another article!
For now, I hope that measuring call centre agents on the number of calls handled will no longer be a focus for you.
Recommended further actions:
- Read & Download: Learn more about Erlang C and download the free calculator >>>
- Attend a course. We have a range of specialist contact centre management courses from introductory to advanced. Search CX Skills >
- Search all the Contact Centre industry events on the CX Industry Events Calendar >>>
- Read: The 10 most popular call centre KPIs and what they actually mean

